In The Importance of Math in the Art of Grazing, we walked through how to calculate stocking rates and hopefully you realized how important those calculations are in your management plans! Now that you’ve done some calculations by hand, we are pleased to present the SDSU Extension Grazing Calculator!
The grazing calculator eliminates the guesswork and mess associated with doing calculations by hand. It requires a few inputs on your end, and you’ll be able to save a downloadable Excel file for your record keeping. Use the navigation below to get started, or view the following information and instructional video to learn more about using the calculator.
LAUNCH THE CALCULATOR
Fixed Land/Time
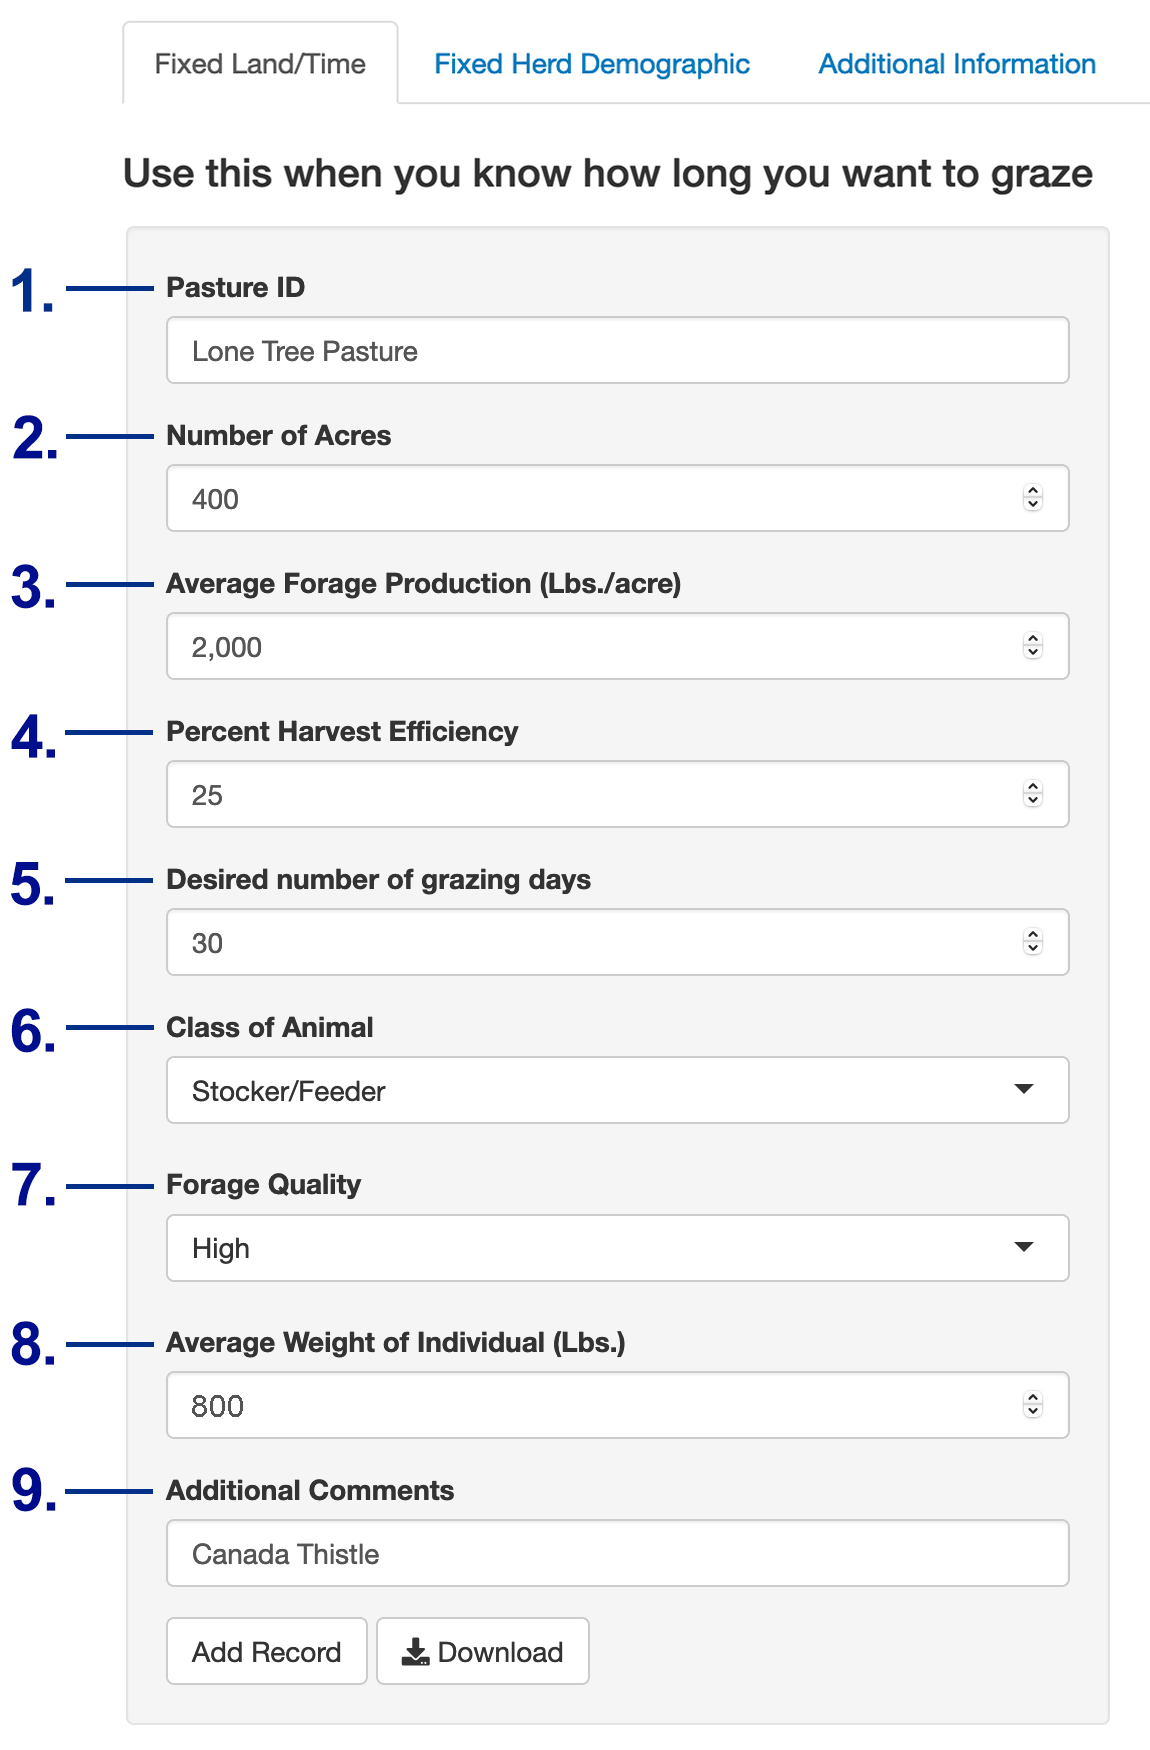
Use this option when you know how long you want to graze your pasture, and you would like to know how many cattle your pasture can support for your desired grazing period (Figure 1).
INPUTS
- Pasture ID: Name of your pasture. For example, “Lone Tree Pasture.”
- Number of Acres: Size of your pasture.
- Average Forage Production (Lbs./acre): If you remember from The Importance of Math in the Art of Grazing: Part 1, this is where you need to use the USDA NRCS Web Soil Survey website, or you can use a “clip and weigh” method, or a grazing stick. Your local NRCS or SDSU Extension office can get you started with any of these methods.
- Percent Harvest Efficiency: Harvest (Grazing) Efficiency can range from 25% to 40% depending on management intensity. In order to maintain adequate forage production and health, the target utilization level for many species is about 50%. This means that 50% of the plant weight remains behind in the pasture, and 50% is available for use—of that 50%, approximately 25% is beneficially used, leaving 25% that ideally is ingested by the animal. This harvest efficiency can be increased through management intensity; however, it is generally not recommended to go above 35%.
- Desired Number of Grazing Days: How long do you want to be in said pasture in terms of days?
- Class of Animal: Drop-down menu for animal class. Classes include: Stocker/Feeder, Bulls, Cow Lactating, and Cow Dry. Selecting the animal class tells the calculator what the forage demand is on a dry matter intake (DMI) basis, which is presented as a percent of body weight (BW).
- Forage Quality: Drop-down menu that allows you to select forage quality. Options include: High, Medium, and Low. The calculator uses the guidelines in Table 1 for forage DMI.
- Average Weight of Individual (Lbs.): Enter the average weight of an individual in pounds.
- Additional Comments: This is where you can make notes to include with your pasture record. For example, broken fences, weed infestations, native plant growth, or new species.
| Class of Animal | Forage DMI, % of BW |
|---|---|
| Stocker/Feeder or Bull | 2.5 |
| Cow Lactating | 2.2 – Low-quality forage 2.5 – Medium-quality forage 2.7 – High-quality forage |
| Cow Dry | 1.8 – Low-quality forage 2.2 – Medium-quality forage 2.5 – High-quality forage |
RESULTS
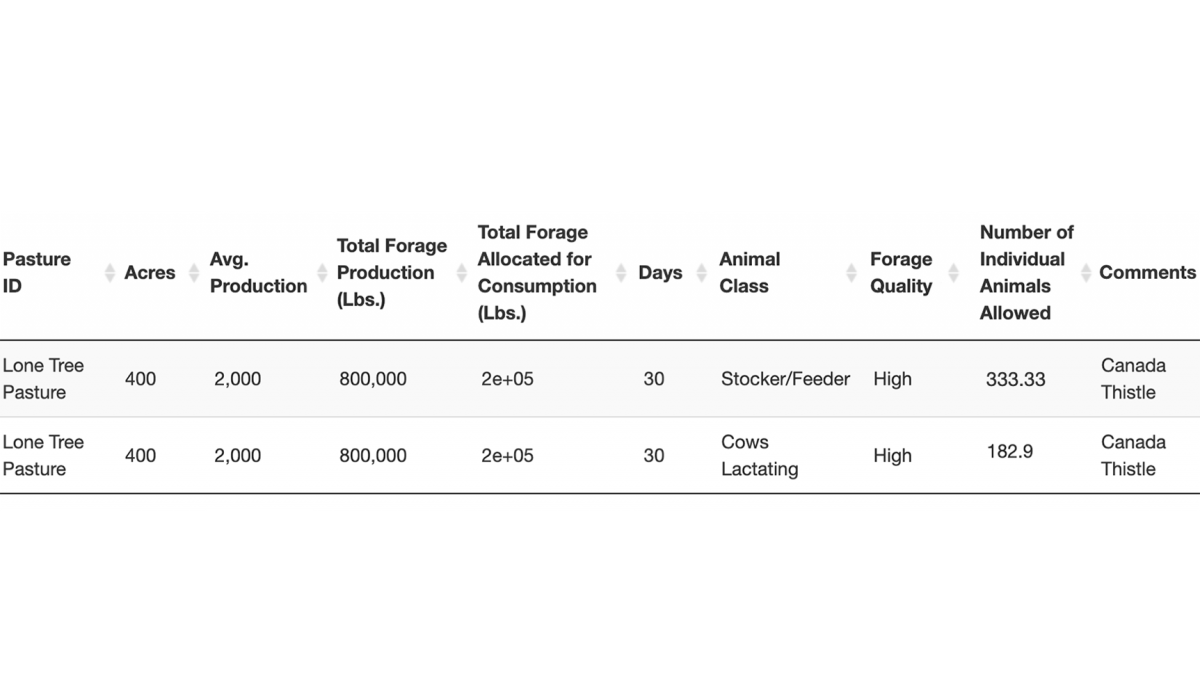
The benefit of the grazing calculator is that you can adjust your inputs, it quickly does the calculations, and you can instantly see how that would change your numbers. For example, maybe we’re having a good year in terms of precipitation, so you’re looking to add some income through custom grazing.
In the example results shown in Figure 2, the “Lone Tree Pasture” on average producers 2,000 pounds of forage per acre, and the forage is high quality. It can support about 333 stockers (800 lbs. average weight) or 182 pairs (1,350 lbs. average weight) for 30 days. This type of information can provide you with an excellent starting point for negotiating leases, as outlined in Structuring Grazing Leases.
Fixed Herd Demographic
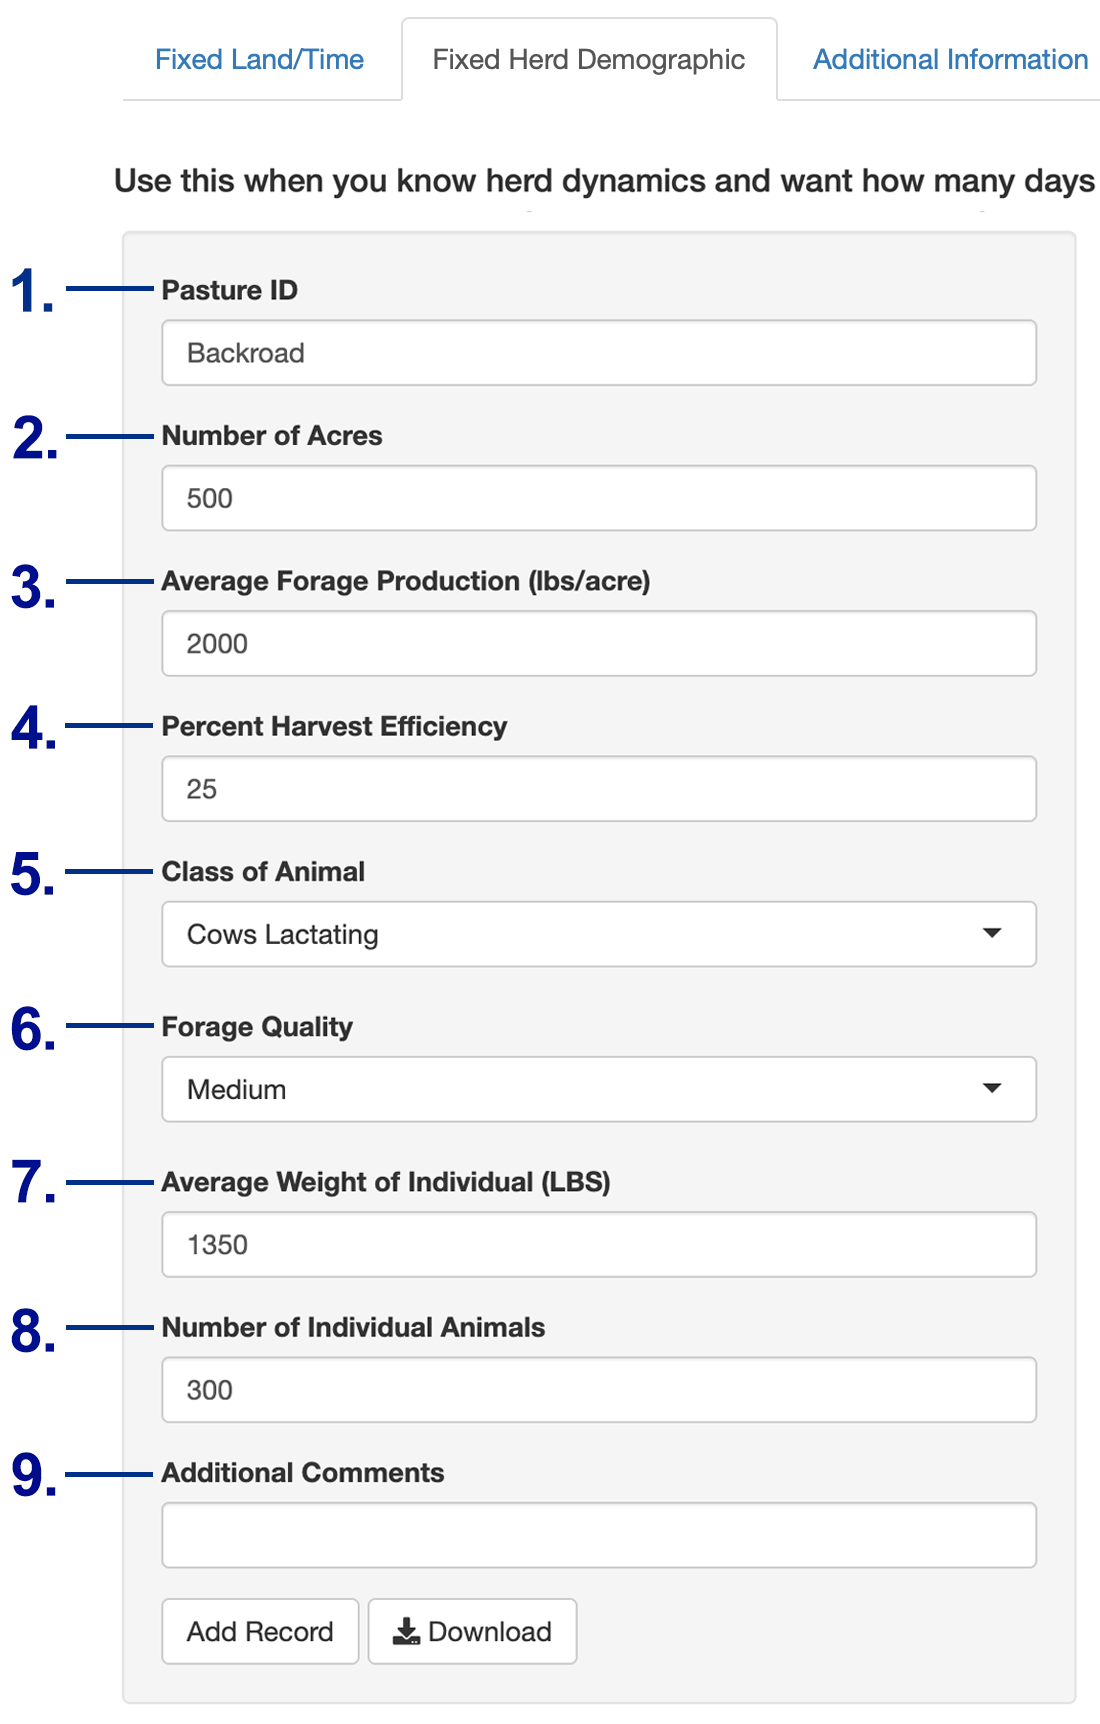
Use this option to find out how many grazing days your pasture can support given the size and makeup of your herd (Figure 3).
INPUTS
- Pasture ID: Name of your pasture. For example, “Backroad.”
- Number of Acres: Size of your pasture.
- Average Forage Production (Lbs./acre): If you remember from The Importance of Math in the Art of Grazing: Part 1, this is where you need to use the USDA NRCS Web Soil Survey website, or you can use a “clip and weigh” method, or a grazing stick. Your local NRCS or SDSU Extension office can get you started with any of these methods.
- Percent Harvest Efficiency: Harvest (Grazing) Efficiency can range from 25% to 40% depending on management intensity. In order to maintain adequate forage production and health, the target utilization level for many species is about 50%. This means that 50% of the plant weight remains behind in the pasture, and 50% is available for use—of that 50%, approximately 25% is beneficially used, leaving 25% that ideally is ingested by the animal. This harvest efficiency can be increased through management intensity; however, it is generally not recommended to go above 35%.
- Class of Animal: Drop-down menu for animal class. Classes include: Stocker/Feeder, Bulls, Cow Lactating, and Cow Dry. Selecting the animal class tells the calculator what the forage demand is on a dry matter intake (DMI) basis, which is presented as a percent of body weight (BW).
- Forage Quality: Drop-down menu that allows you to select forage quality. Options include: High, Medium, and Low. The calculator uses the guidelines in Table 1 for forage DMI.
- Average Weight of Individual (Lbs.): Enter the average weight of an individual in pounds.
- Number of Individual Animals: This where you input the number of head of the ‘Class of Animal’ you selected, since you want to learn how many days a pasture can support.
- Additional Comments: This is where you can make notes to include with your pasture record. For example, broken fences, weed infestations, native plant growth, or new species.
Results calculated on the “Fixed Herd Demographic” tab show how many “Total Herd Days in Pasture” your land can support based on the information you input.
For example, if you have a “Backroad” pasture with 500 acres of land, 2,000 pounds-per-acre forage production, and medium quality forage; and your current herd consists of 300 pairs of lactating cows (1,350 lbs. average weight), your pasture can support your herd for 24 grazing days (Figure 4).
In Conclusion
The Grazing Calculator was designed with the end goal of helping producers calculate stocking rates under either a fixed land/time or fixed herd demographic situation. It is meant to be a tool and a resource that is one part of your management plan and your grazing plan. The stocking rate is a starting point in a grazing plan that should also include your short and long term goals, the current state of your forage and livestock, an assessment of critical infrastructure such as fences, gates, water, shade, lanes, working facilities, and hay storage, among others. The other tools and resources you use hopefully include the help of NRCS and Extension staff, such as grazing and range specialists and beef cattle nutritionists. All in all, the art of grazing requires a bit of math, a lot of tenacity, and a management team that understands your goals.
Source
SD State University Extension. If you have any suggestions for improvement to the Grazing Calculator, please contact, Krista Ehlert or Jameson Brennan.
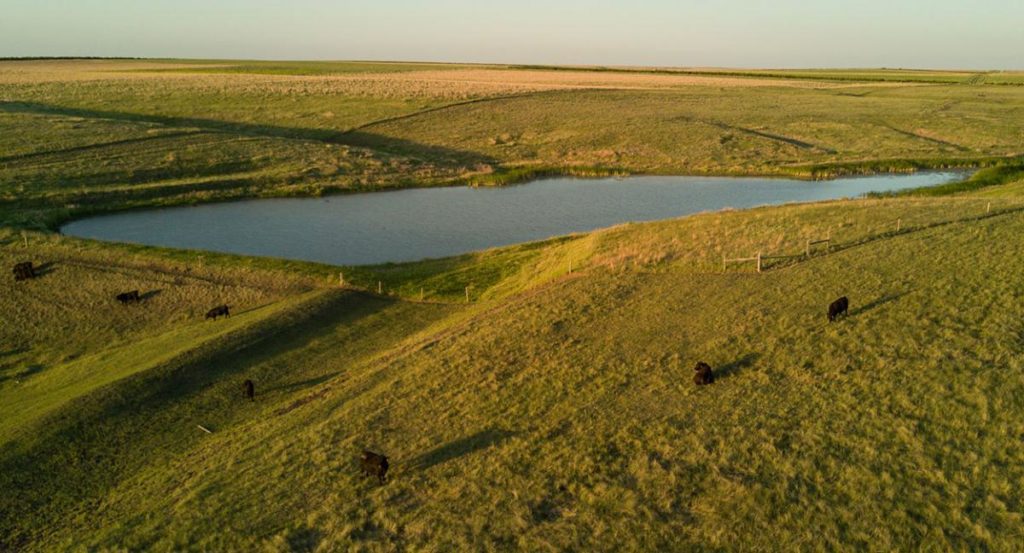
Photo Courtesy: USDA NRCS South Dakota [CC BY-SA 2.0]