Not every cow is going to be profitable, even when calf prices are high. It is important to consider the quality of cows as well as their costs. Paying too much for good cows is as bad as paying little for horrible ones. Producers who intend to be profitable must consider closely the relationship of current and future costs, to current and future revenues, and cow longevity and productivity.
The first step in figuring out whether to buy or keep replacement heifers is to know what it costs to raise them, what it would cost to buy them, and have an educated idea of what they are expected to return over their lifetime.
The following analysis is our educated idea of what several of the breakeven points for replacement heifers might be on various types of operations. It is important to know your own numbers to make good decisions about buying or retaining replacement heifers.
This is the sixth annual beef cow replacement value forecast created by researchers and extension personnel at the University of Nebraska for the beef cattle industry. This baseline of beef heifer replacement values is intended as a starting point to help cattle producers as they decide to buy, sell or trade replacement cows.
These forecasts are derived from the set of complex interrelationships among the present and future costs, productivity and revenue of cows, calves and productive materials and assets (pasture, feed etc.), many of which are themselves forecasts. The information here is a guide, which users would be expected to modify, depending on their circumstances and expectations of future productivity, costs, and revenues. The forecasted price and cost variations were those created by the University of Missouri Food and Agriculture Policy Research Institute (FAPRI) as the current 10-year projections. These annual FAPRI changes were used to adjust the future expected costs of Nebraska producers starting with the current season, 2023.
Valuing replacement heifers
Selecting replacement heifers differs from ranch to ranch, but value for both retained and purchased replacements generally depends on:
- Longevity – the replacement heifer’s ability to productively stay in the herd
- Productivity – both current and future expected difference between cost and revenue (calf price and production costs differences over the heifer’s productive life)
- Genetic and phenotypical compatibility with herd mates (the animal conforms with the production system and performance goals)
- Operator goals and management style (heifer’s contribution to the future of the ranch)
- Financial standing, specifically debt related to cow purchases.
These forecasts assume producers know two things about their operation:
- Annual cost of production per cow. Authors used UNL’s Cow Cost Cow-Q-Lator combined with Nebraska producer production information and real estate survey data to calculate three levels of costs, low, medium and high.
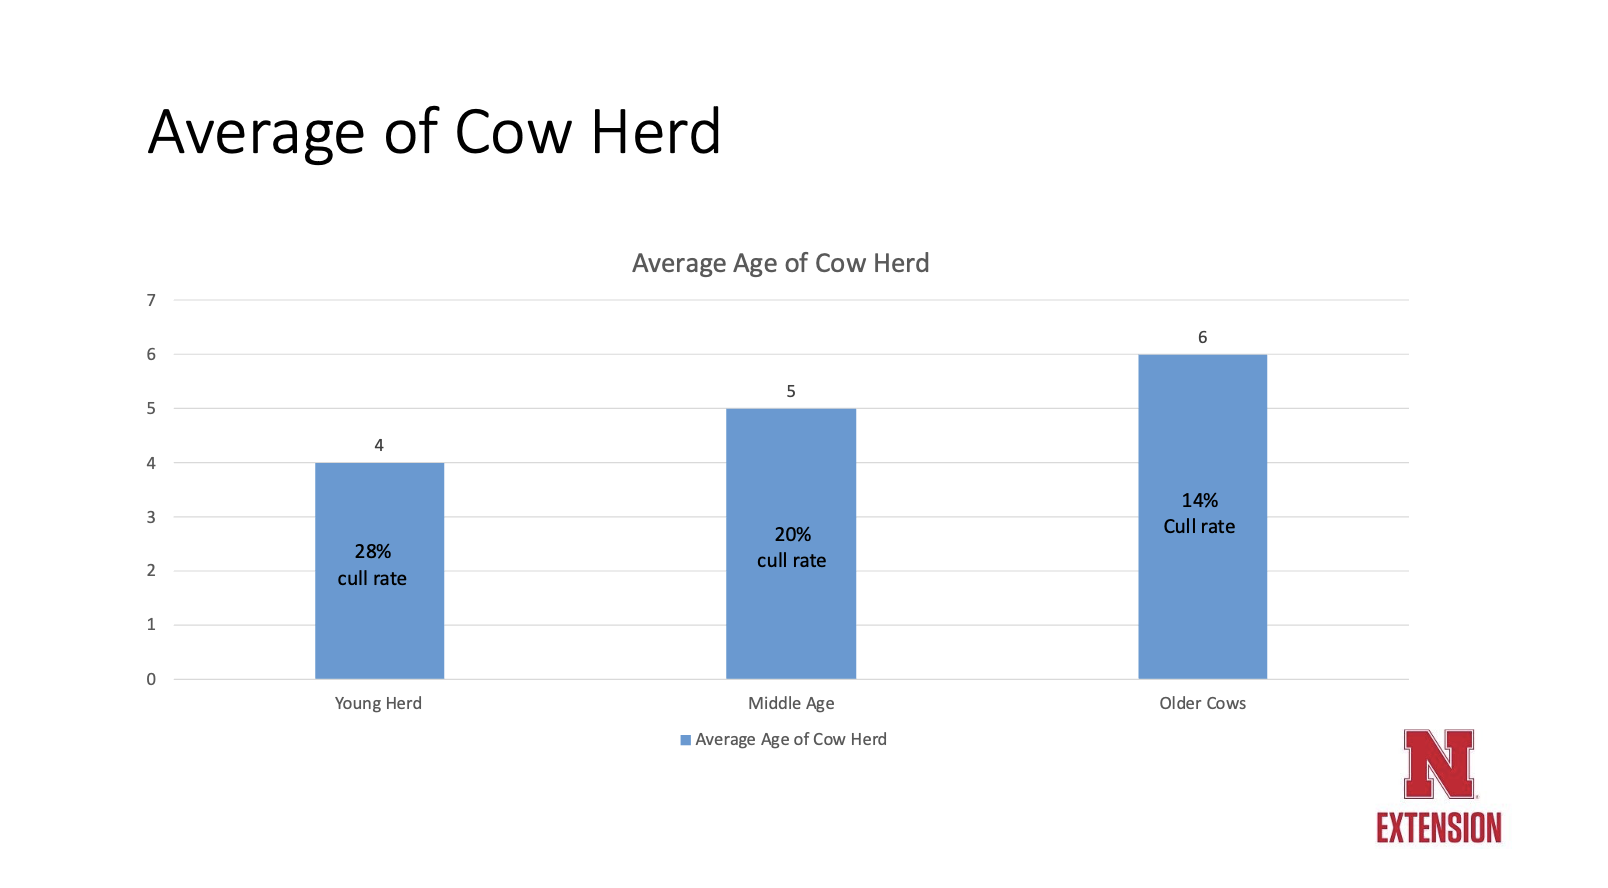
- Three average levels of cow replacement rates, 14%, 20% and 28%. This is the percent of heifers needed each year to keep the herd at a constant size. This number is representative of the number of annually replaced culled or dead cows and is a practical and tractable measure of cow longevity.
Figure 1. The three levels of cow replacement
The three annual costs of production for 2023 do not include calving rate, replacement cost, depreciation expense, or death loss. These variables are accounted for within the simulation itself. The 2023 annual production costs per cow were identified as, low of $931/cow, medium of $1007/cow, and high of $1080/cow. As stated, the values and costs were adjusted annually for 10 years within the simulation using FAPRI 2023 projections. Costs relate directly to the UNL Ag Economic Real Estate Report for 2023 state average with a low of $50.80/pair/month, median $61.0/pair/month, and high rate of $69.1/pair/month. These rates were averaged for eight USDA statistical districts in Nebraska. Winter rates were half of those charged in the summer. The costs of pasture ranged from about 38-43% of all costs and 65-68% of total feed costs, while feed costs ranged from 56% to nearly 60% of all costs.
Figuring a replacement heifer breakeven
It is impossible to anticipate and quantify all possible conditions in which replacement cows are purchased. To help mitigate this challenge three representative levels of production costs and three rates of herd replacement rates were used to create forecasts of replacement heifer breakeven value for the nine different scenarios. In this instance breakeven value is the average value in dollars that a cow purchase would equal the dollars returned by her during her life in the herd.
The nine forecasts are a result of an individual cow simulation for 25,000 purchased heifers are randomly bought, produce calves, and sold in the next 11 years. The biological productivity and animal size are a reflection of historical production information obtained at UNL’s GSL facility.
The three cost scenarios were evaluated at 14%, 20%, and 28% annual herd replacement rates with three levels of costs, $931/head low, $1007/head medium and $1080/head high.
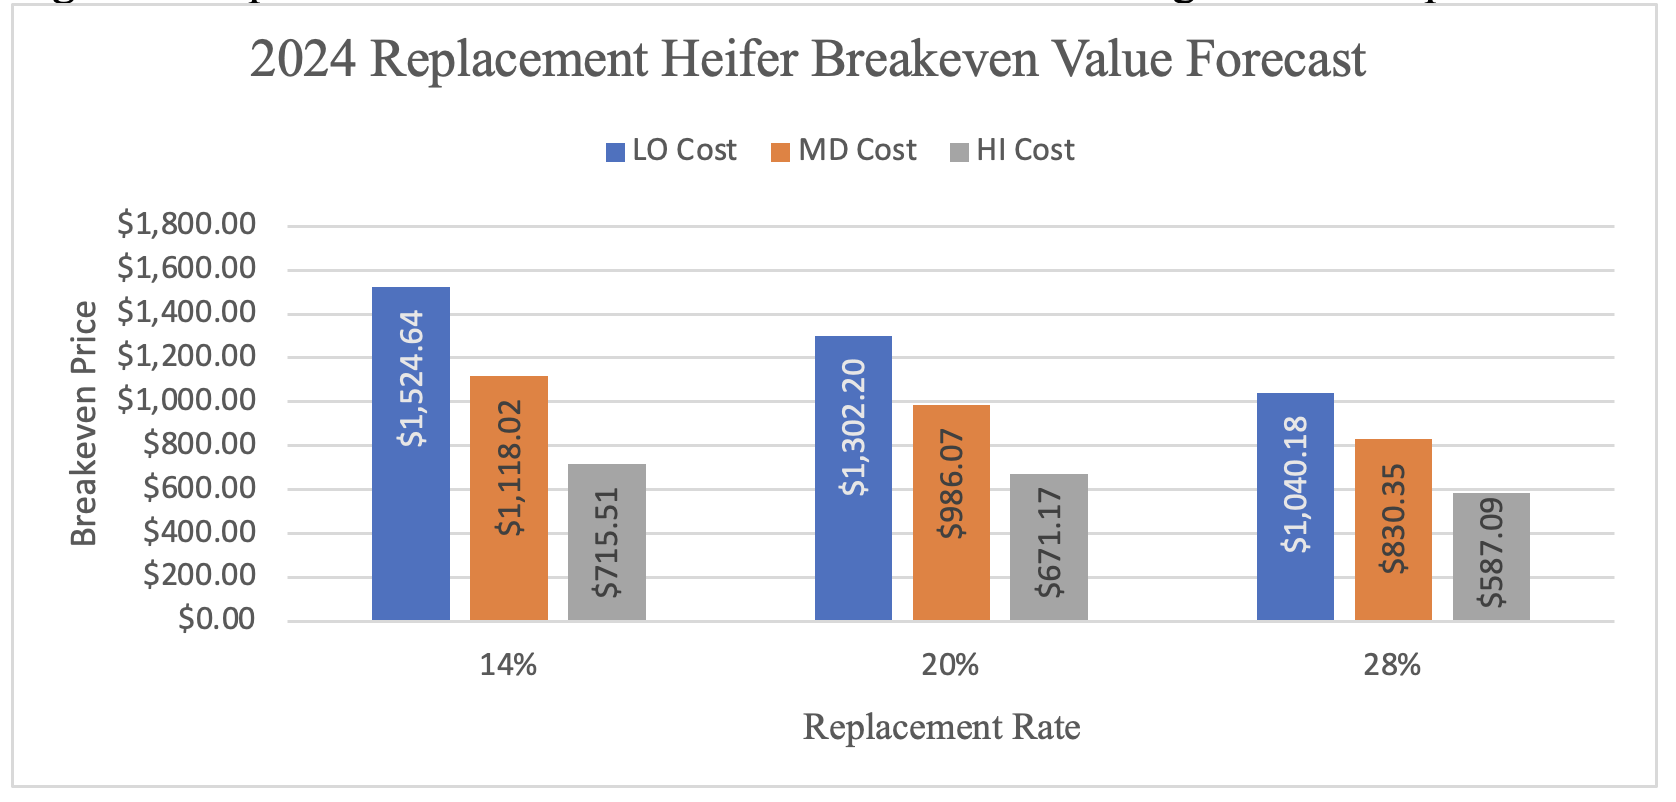
All heifers were purchased at an average value of $1,934.50/hd. Purchase value is not the breakeven value. The predictions are graphically depicted in Figure 2. As expected, the 14% replacement rate had the highest breakeven values, with $1524.64/hd., $1118.02/hd. and $715.51/hd. for the low, medium and high costs respectively. The herd with the 20% replacement rate, more typical, had breakeven values of $1302.20/hd., 986.07/hd. and 671.17/hd. for the low, medium, and high costs respectively. The highest level of replacement, 28%, not surprisingly, had the smallest breakeven values for each level of cost. At the low costs it was predicted that breakeven would be $1040.18/hd., the medium costs had a breakeven of $830.35/hd., with the high cost herd’s breakeven was forecast to be $587.09/hd.
Figure 2. Replacement heifer breakeven value forecasted average cost and replacement rates
In all cases increasing productivity without altering costs resulted in greater revenue, which increased predicted profit making it possible to pay more for replacements. The accuracy of the forecast is dependent on how closely an operation’s current and future productivity and revenue match those specified in the simulation.
Productivity changes include calving rates and calf growth rates among other important measures. Revenue changes also play a role in altering breakeven value. Demand and supply shifts that alter cattle prices also have an impact on replacement heifer breakeven value. Higher calf prices lead to higher breakeven values, while lower prices lead to lower breakeven values. Accurately forecasting these values leads to better forecasting cow’s replacement values. An economically successful producer, on average, buys or raises replacement heifers for at least no more than what she returns in her lifetime and hopefully less.
Low cost, low replacement herds (14%) can afford higher-valued replacement heifers and replace capital faster in their operations (Table 1, below). When raising or purchasing replacement heifers, each heifer’s value is based on her ability to stay in the herd and the producer’s ability to manage that productivity, control costs, and use the market to their advantage. Applying these principles is key to making an operation more profitable and resilient.
A positive outcome in purchasing replacements over time comes down to the animal’s ability to return as much or more value than was paid for her. This is only accomplished if the operation selects the right type of animals (animals suited to flourish under their management and care), at the right price and the right time.
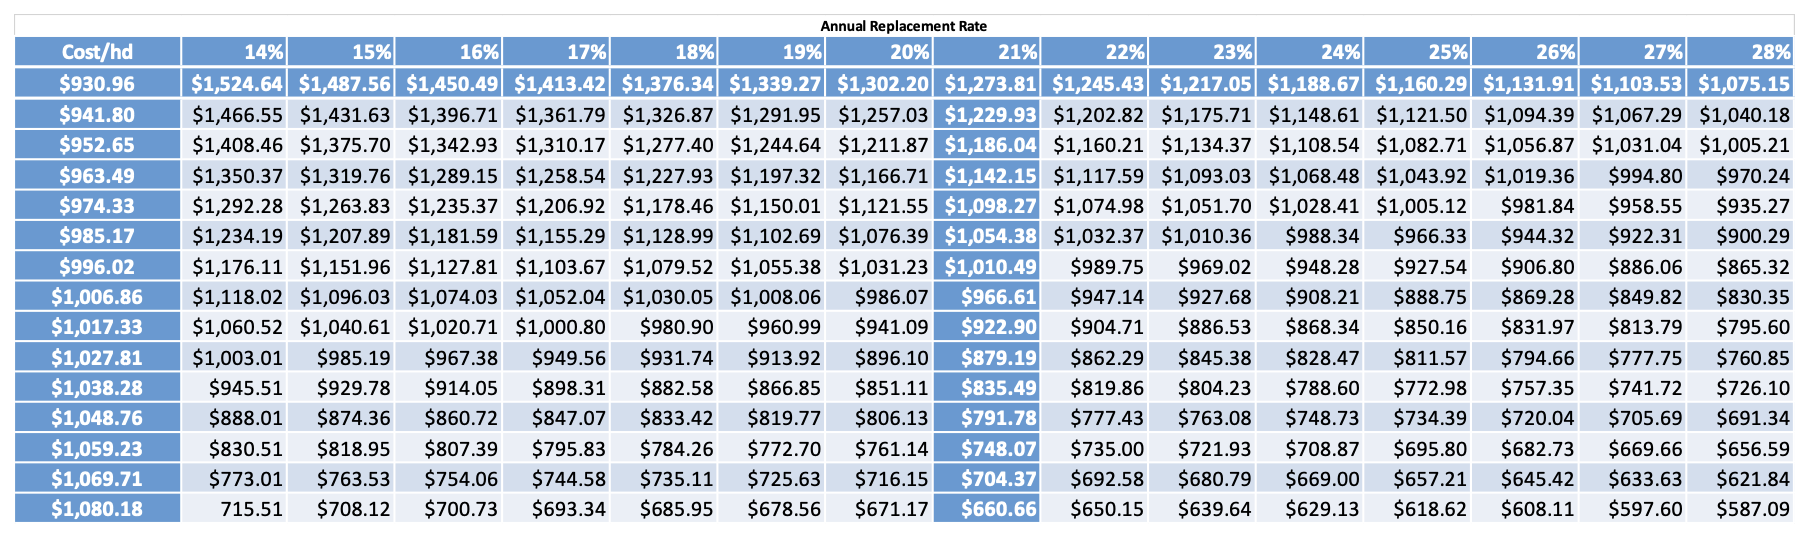
Raising replacements does not make them free; in fact, it is important to know what they cost to raise and how they rate in value, relative to purchased animals. In Table 1 moving from right (28%) to left (14%), lower replacement rates mean a higher percentage of cows are older and have a longer productive life. As the longevity of a replacement cow increases, breakeven values increase, except when annual production costs exceed annual revenue, in which case owning cattle for that year becomes a liability. Also note from Table 1 that as costs decline breakeven values increase and annual profit increases, providing additional funds to pay off cow purchase costs.
The following table is valuable and can be used to extrapolate changes in replacement cow breakeven values based on replacement rate and/or annual production costs.
Table 1. Breakeven values of beef cow replacements based on annual production cost and replacement rate with no borrowed money.
The prices paid for replacement heifers have declined over last year’s forecast. The increased costs compared to smaller increases in calf returns which FAPRI predicts to increase for the next 5 years of the next 10-year outlook. Costs have increased more than the increased return on calves. This has lowered what can be paid for replacements compared to last season. The current probability of successfully paying for a heifer that costs $1940.50/hd. are listed in Table 2 below by replacement rate and costs level.
Table 2. Probability of paying back the $1,940.50/hd. purchase price of the heifer, under each of the nine scenarios.
| Probability of paying off the average cost of $1,904.50 cost for a replacement heifer bought in Dec 2023 for the 2024 season (2.10 of Utility Cow price) | ||||
| $/hd | Cost type | 14% culling rate | 20% culling rate | 28% culling rate |
| $931 | Low | 35.3% | 22.1% | 12% |
| $1007 | Medium | 3.2% | 1.9% | 1% |
| $1,081 | High | .016% | .024% | .008% |
Even at the lowest cost and replacement rate there is only an expected probability of 35.3% of replacement heifers paying back the whole purchased value of $1940.50/hd. It should be noted that some individuals will pay back more than this purchased value while the majority (64.7%) will not. This overpayment is captured in the average breakeven values reported here.
This brings up an interesting discussion point. If the price paid for all replacements were the breakeven value of $1524.64 (Table 1), the probability of each cow paying her own way would be 52.2%. This indicates the remaining 47.8% would not pay for their purchase value. However, the 52.2% that did would include many that would cover a higher purchase value and as a result on average purchased cows would breakeven. Going back through the historical price data it was found that from 2008 to 2012 replacement cow prices averaged about 1.69 times as much as December cull cow prices in Sioux Falls South Dakota ($1,481.42/hd.). Using this factor instead of 2.10 from the 2013 to 2022 period resulting in the 2023 ($1940.50/hd.) value, the probabilities of success increased substantially. Table 3. Not every cow is going to be profitable, nor are all cows going to create a loss. It is important to consider the quality of cows as well as cost. Paying too much for good cows is as bad as paying little for a horrible one. In the final analysis producers who wish to be profitable must consider closely the relationship of current and future cost to current and future revenue, cow longevity and productivity.
Table 3. A listing of a selected number of probabilities of paying back the reduced costs of the $1,481.42/hd. purchase price for replacement heifers December of 2023.
| New probabilities of paying off the lower average cost of $1481.42 cost for replacement heifer bought in Dec 2023 for the 2024 season (based on 1.69 of Utility Cow Price) | ||||
| $/hd | Cost type | 14% culling rate | 20% culling rate | 28% culling rate |
| $931 | Low | 53.3% | 37.6% | 22.0% |
| $1007 | Medium | 27.6% | 18.4% | 10% |
| $1,081 | High | 2.0% | 1.7% | 1.0% |
Presentation by the authors of this report was hosted by UNL’s Center for Agricultural Profitability, as a webinar, and is available here.
SOURCE: University of Nebraska, Lincoln. Institute of Agriculture and Natural Resources. UNL Beef.
Randy Saner, Nebraska Extension Educator
Shannon Sand, Nebraska Extension Educator
Matt Stockton, Nebraska Extension Ag Economics Specialist